A very simple data logging setup for Revit with PyRevit
How to visualise your addin data usage to show how great your tools really are.


Every BIM Manager should be able to log their addin usage data, no matter their level of coding ability or how little budget they have, all in 15 minutes.
The guide below is for those who are just starting out and need as much hand-holding as possible.
The setup is quick and easy and you don’t need the company credit card, so there really is nothing stopping you.
And we’re making an automated process, so if you invest 15 minutes now, all you have to do is hit ‘Refresh’ before every presentation and everything updates. This is an investment which will keep on paying you back.
Why Visualise Data?
Visualising usage data is very handy if you want to demonstrate Addin value to your firm’s Partners or Board.
You could log usage against an estimated time saved, and multiply that by the charge out rate for your staff.
Now, when you want to ask for resources for new tools, this is a cost saving for the firm, not an overhead.
Visualising usage data is also handy to optimise your firm’s usage of addins.
The increased visibility allows you to identify your ‘Addin champions’, folk who will get out there and spread the word on these tools.
You can also identify those teams who are not making as much use of the tools as they could be. So now you know where to focus training and offer support understand problems and ensure value is maximised.
FYI!
If you are comfortable coding, you may find that you would prefer to setup PyRevit’s own Telemetry System rather than the system defined below. It is a great system, go check it out! https://pyrevitlabs.notion.site/Telemetry-System-992d72659457447f86b79cf1c9034541
If, however you find that a bit worrying, see if this feels a little more manageable as a start...
The Plan
What we’ll do is make little text files logging usage data in a folder you define on your server.
Then we’ll read those files with Power BI, to create engaging, informative visualisations which automatically update.
The steps below build on the amazing work of the PyRevit builders and wider community. Thank you all! And anyone reading this should consider contributing to keep the PyRevit project running.
Step 1 – PyRevit
Go get PyRevit, if you haven’t already, and go have a watch of the Aussie BIM Guru’s youtube videos, they are an excellent way to start getting into your automations!
https://www.youtube.com/watch?v=oVRJW-F0wEo
He even has a toolbar you can download, so now you have all the PyRevit tools and Gavin’s as well! For nothing!
https://github.com/aussieBIMguru/guRoo
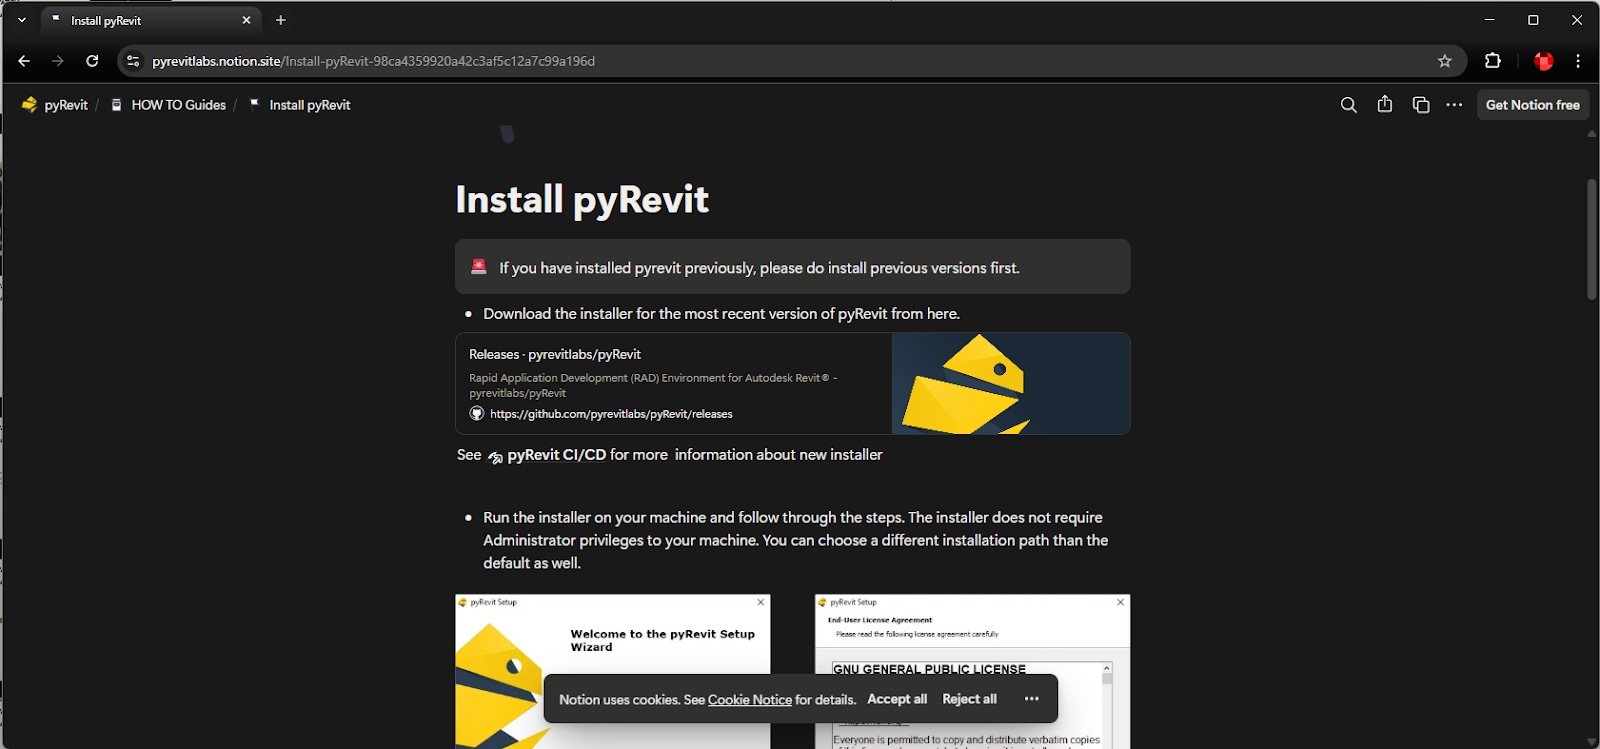
The PyRevit install guide is here…
https://pyrevitlabs.notion.site/Install-pyRevit-98ca4359920a42c3af5c12a7c99a196d
Talk to your IT folks about deployment, or drop it in a shared folder and show your staff how to do it, depending on your Firm’s scale!
Download Link for PyRevit here…
https://github.com/pyrevitlabs/pyRevit/releases
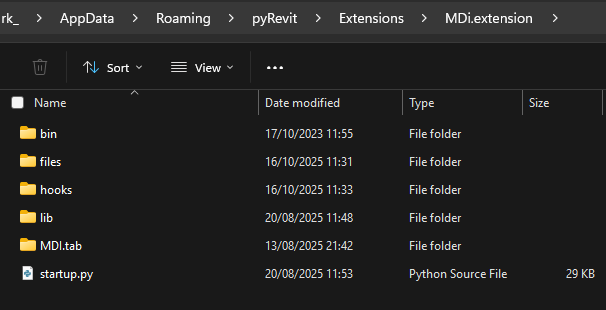
Where PyRevit Extensions Live
You will notice that Gavin’s toolbar drops into a folder here:
C:\Users\[UserLogin]\AppData\Roaming\pyRevit\Extensions
(You can also pasting this into Windows Explorer)
%AppData%\pyRevit\Extensions
This is great, because PyRevit will read it by default and load it when Revit starts, super simple for users.
Again, ideally you can give your Extension folder to IT and they can auto copy it into everyone’s folders for them. But if not, you can show users how to do it themselves.
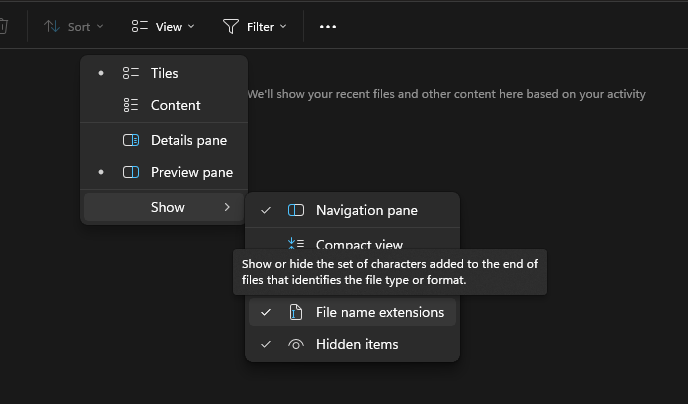
Show known file extensions and hidden files
Now, if we’re going to be playing around with files, we’re going to want to see our ‘known file extensions’ in Windows Explorer. Let’s quickly do that and you may as well show Hidden Items while you’re at it.
Step 2 – Making Log Files
Now we have PyRevit, all we need is a little Python code to grab the data and save it when a user clicks an Addin button…
If you click inside the Extension folder, you will see the ‘hooks’ folder.
Hook files allow you to ‘hook into’ events in Revit.
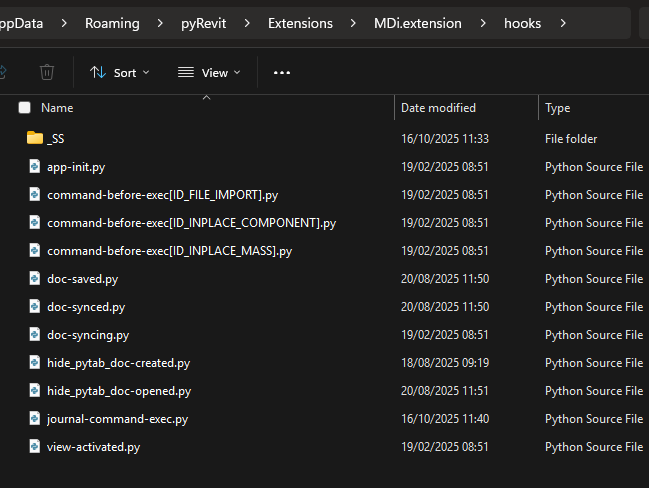
As you can see, there are lots of possibilities here! We’ll talk more about them later.
Ok, let’s code!
So, if we right click in the hooks folder and make a New > Text Document
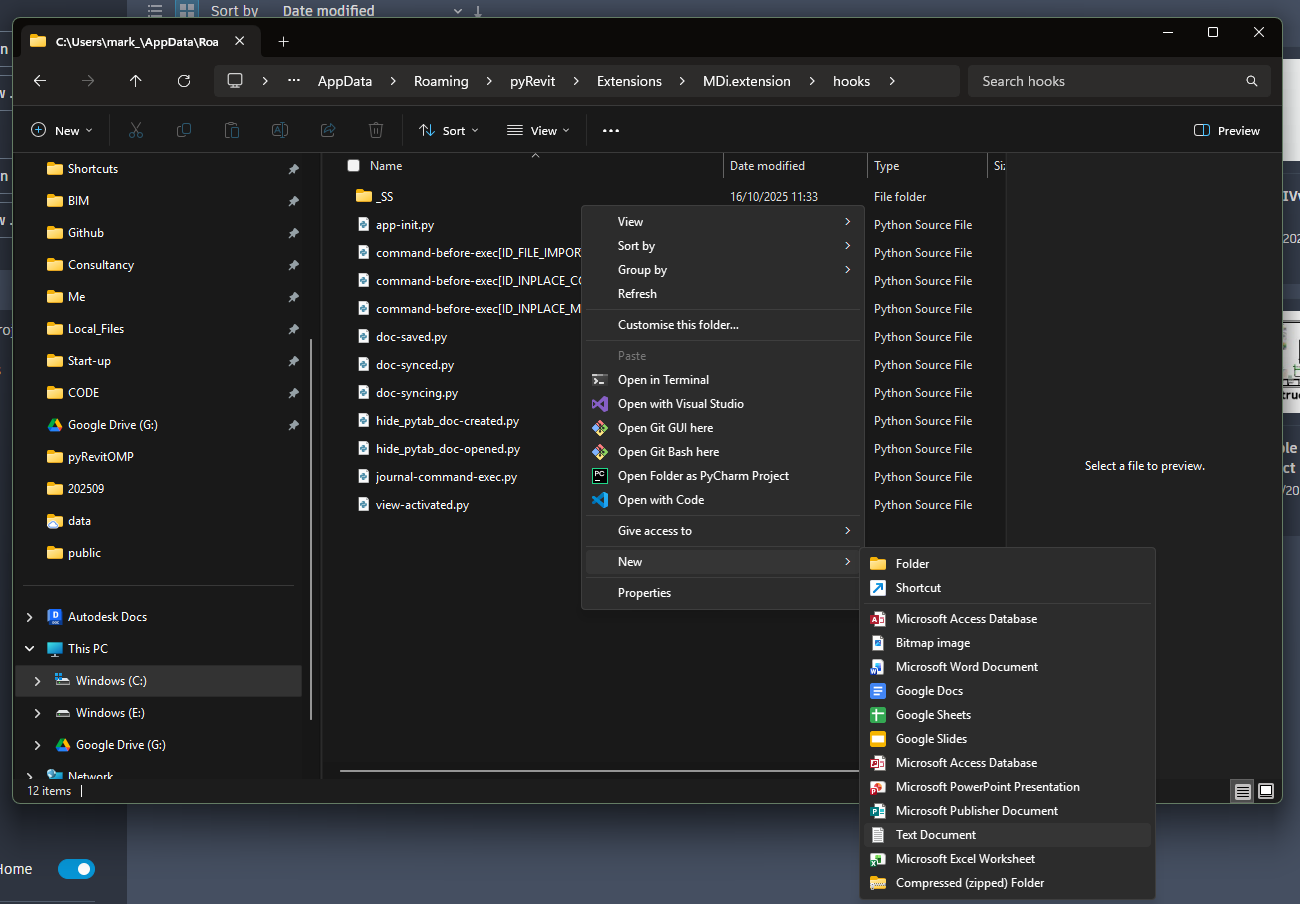
We can rename it as:
journal-command-exec.py
This special name is what PyRevit will look for. If it finds it, it will know to run it, everytime an Addin button is clicked.
Our code is super simple, it takes milliseconds to run, so the user will not even notice.
Now we just need to edit the file and give it our code.
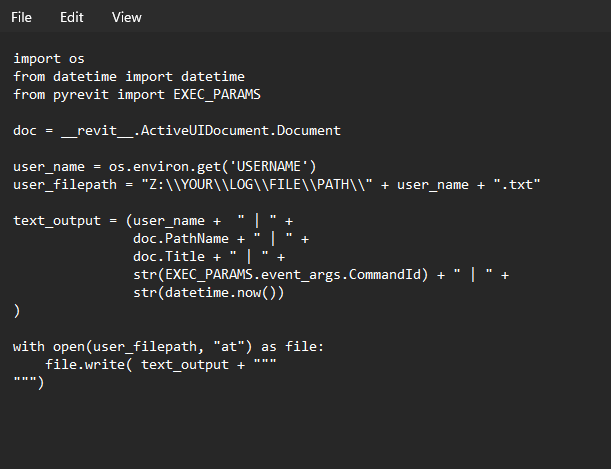
Right click and open it with NotePad, and paste in the following:
import os
from datetime import datetime
from pyrevit import EXEC_PARAMS
doc = __revit__.ActiveUIDocument.Document
user_name = os.environ.get('USERNAME')
user_filepath = "Z:\\YOUR\\LOG\\FILE\\PATH\\" + user_name + ".txt"
text_output = (user_name + " | " +
doc.PathName + " | " +
doc.Title + " | " +
str(EXEC_PARAMS.event_args.CommandId) + " | " +
str(datetime.now())
)
with open(user_filepath, "at") as file:
file.write( text_output + """
""")
It should look like this…
WARNING! CODE IS VERY SPECIFIC!
If you change the code, even slightly, it may not run. If you change a letter or add a space, you might get a failure, so just paste it right in there as it is!
Central Folder for Logs
The only thing we need to customise is the file path. You will notice the use of \\ this is deliberate, make sure that you also use \\ when you put in your folder path.
e.g. you might have a folder you want all the logs to go in, it might be somewhere like
Z:\Library\BIM\Usage\LogFiles
And you would put this into your code:
Z:\ \Library\\BIM\\Usage\\LogFiles\\
What the code is doing
To make the code as unscary as possible, I have made it as short as possible. But here is a version with ‘commenting’ in green. To help you understand a bit more about what is going on…
- We load libraries of code to give us the tools to do our task.
- Get the active Revit file, so we can get data out of it.
- Pull the User login, that’s used to name the log file, so they each have a file.
- Build the save path for the log file.
- Build our line of text to add to the log file, using | as a separator
- We get the user name, file path, file name, addin command name and time
- If there is no text file in the folder with the name, it is created and opened
- The log text is added to the file, with a new line, it is saved and closed.
FYI, we are coding in Python now, you are a real coder!
You will notice all the pretty colours, which makes it a lot easier to read!
If you are going to do this a lot, you’ll want to get yourself a proper IDE (Integrated Development Environment). I use VScode, but there are others including PyCharm and Notepad++ all free for you to use.
So, we have PyRevit, our Extension and we have our Hook, we are ready to pull data!
Testing
Do test your code before going further. You should see your server folder being populated with your log file, and the data being added.
If not, then we can add Exception catching, and Print outputs, to help you understand what has gone wrong.
When you do lots of coding in a live environment, your error catching will be a big proportion of your code, but to keep this simple I have stripped that out.
Because it is simple, there is little to go wrong, reach out to us if you get a problem you can’t fix.
Going Live
If you check that this code works for you, you can include it in your deployment,
Now you should start to see your folder being populated with little text files, if you open the text file you should see a line of data per addin button click.
Having a file per user keeps them organised and manageable. Here is a synthetic data set I made up for this guide…
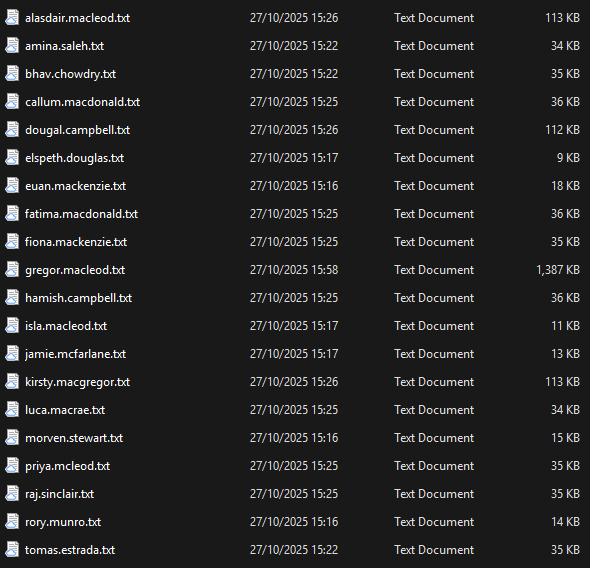
You will notice that one of the files is 1.4meg, that has 10,000 lines of data, yet it opens so fast I can’t even tell. So this system should do what your firm needs unless you get pretty darn big!
Step 3 Visualisation
Now we want to visualise all that data so everyone can see what we’re up to.
Let’s head to Power BI (Business Intelligence), included as part of your office 365 subscription.
If you haven’t looked at it already and it seems like another thing to learn, don’t worry, this is not going to be difficult.
Download from here, and open it up.
https://www.microsoft.com/en-us/power-platform/products/power-bi/downloads
Then we just need to make a blank report…
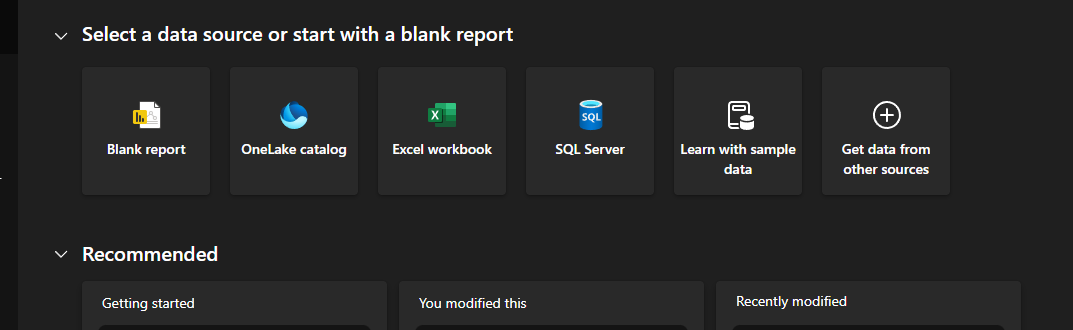
The next window has ‘Add data to your report’
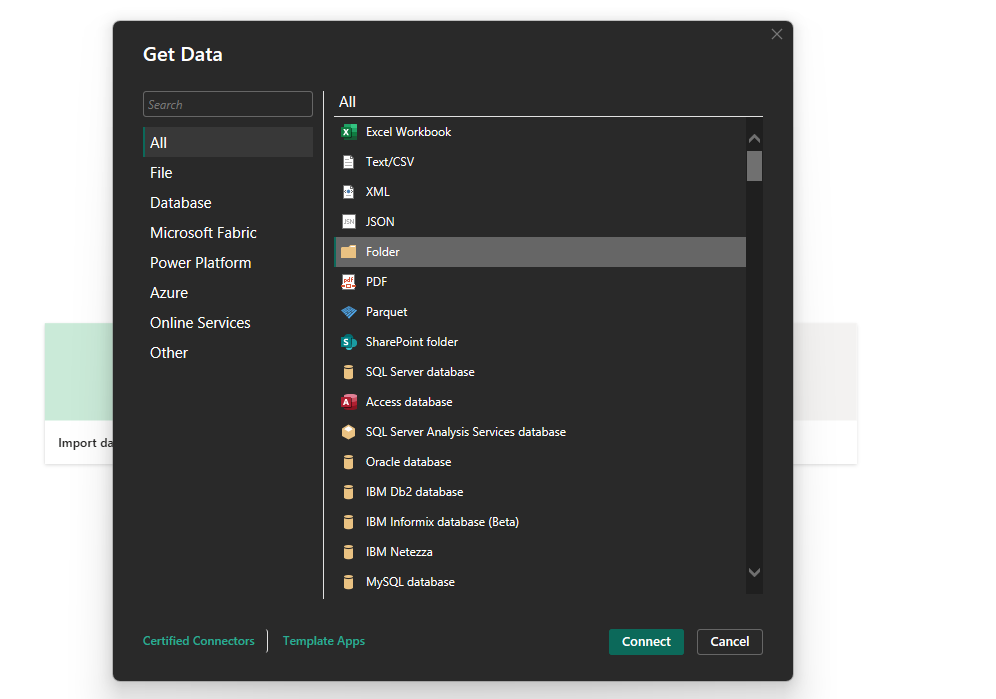
We want to go get a folder, so… Get data from another source in blue at the bottom.
Now just click on Folder and Connect (green at the bottom):
Choose your central path and OK.
The nice thing about this, is that if a new user starts and their log file is created, when we Refresh our Data in Power BI, it will automatically scan through the folder and pick up the new file.
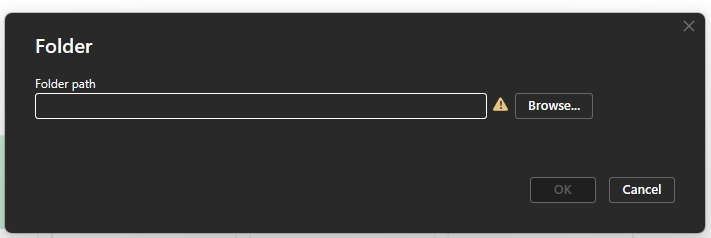
Browse and OK (or I’d copy paste the path in from Windows Explorer).
All the text files will be shown,
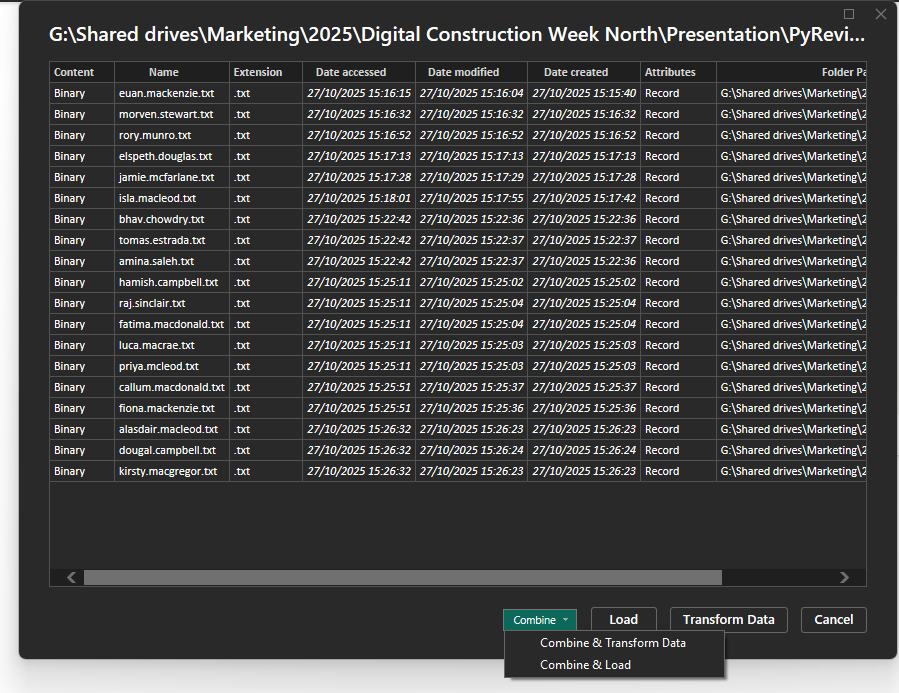
Continue & Transform Data is at the bottom.
And the next window is ‘Combine’ we OK that…
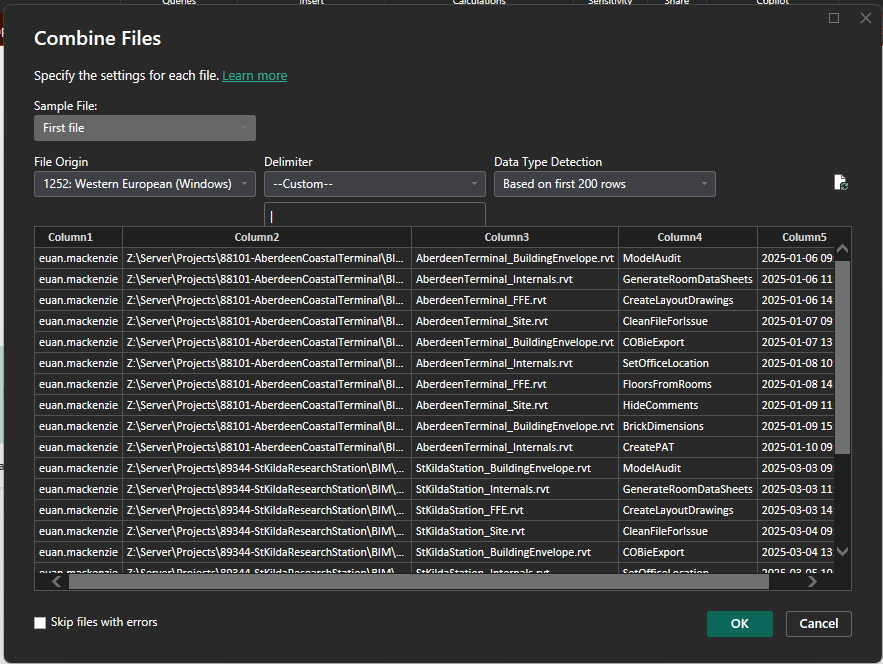
Power BI will run through and open all the files, extract their data and make it into a single table.
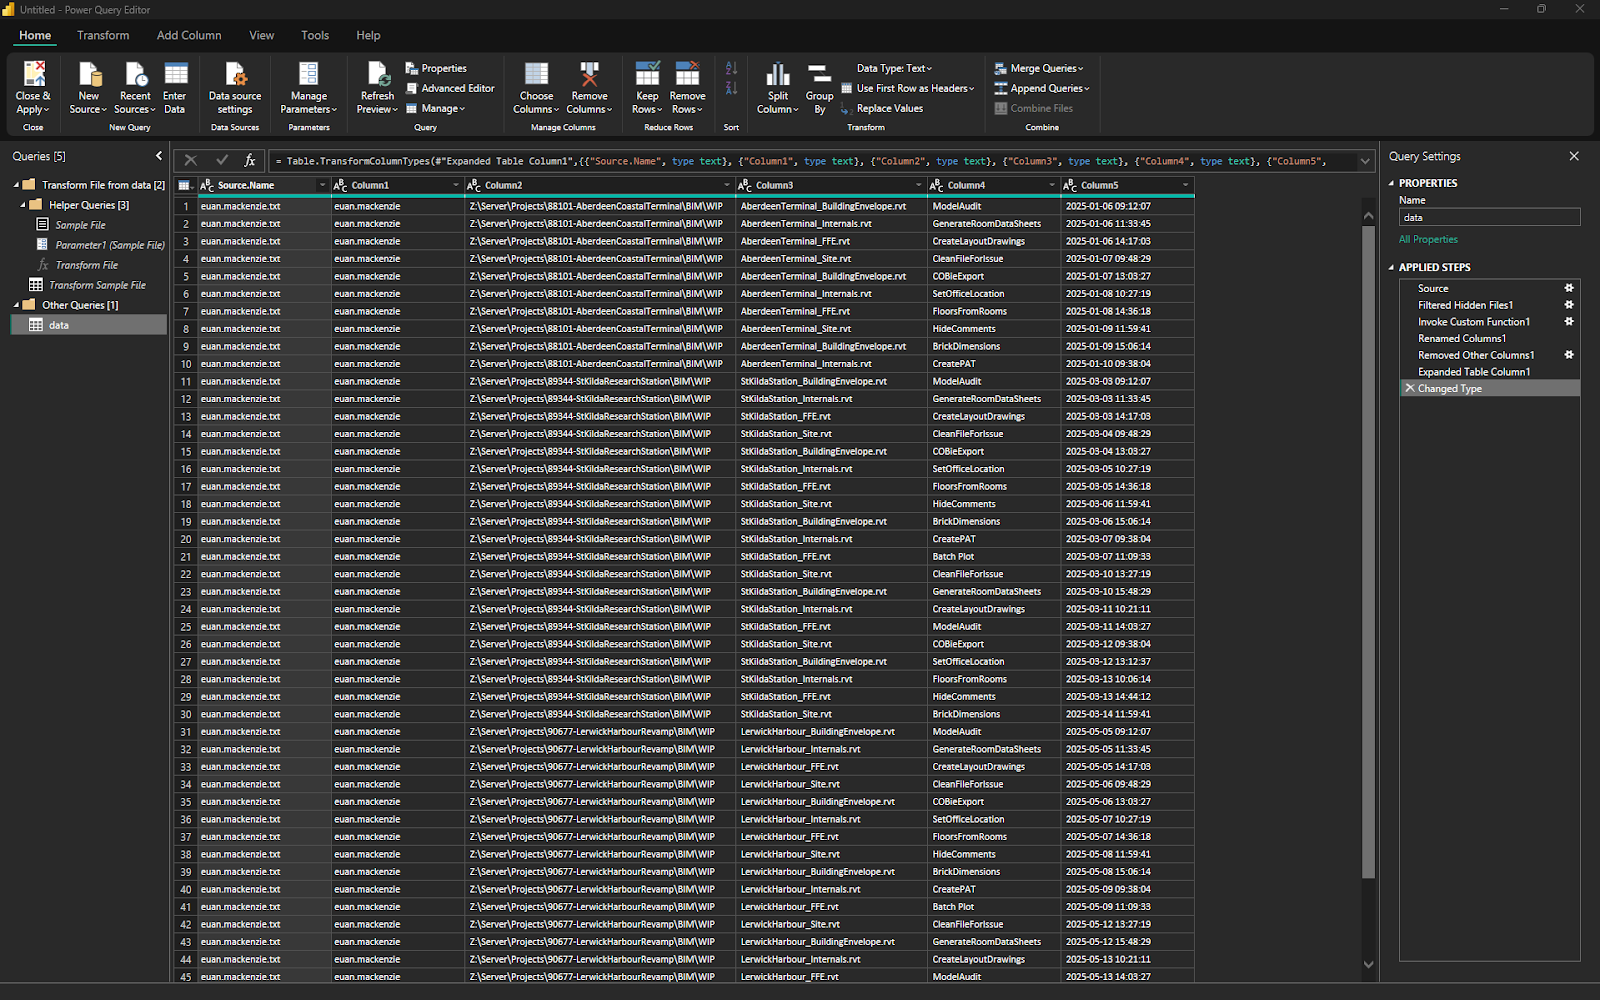
We are doing great! Look at all that, it’s a bit misleading, because rows are only loaded as you scroll down, so the more you pull down, the more data you see.
Now just a little Tidy up, and we can bring in this data to start making graphs.
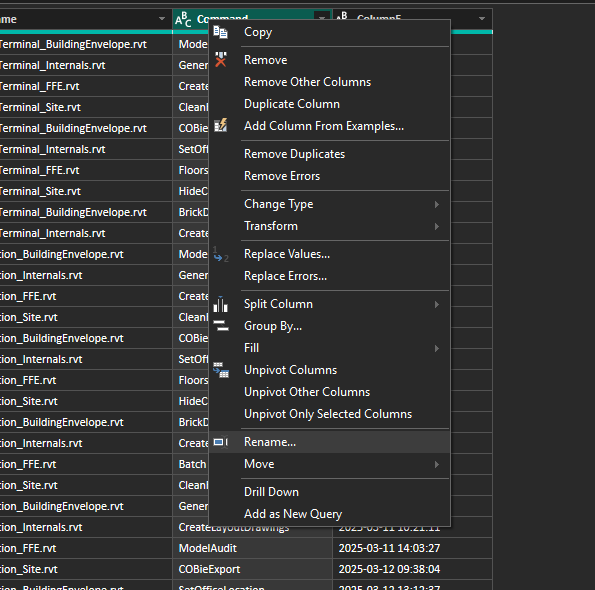
First, we can hide the ‘Source.Name’ column (right click).
We want to rename the headers sensibly, so right click on them and ‘Rename’
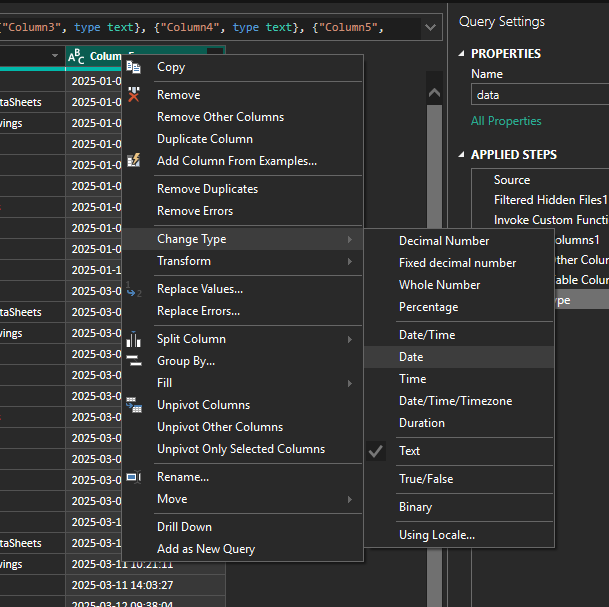
The final step is to change our Date column ‘Type’.
Right now, that column is full of Text, but it is much more useful if Power BI understands that it is actually something smarter. Right click, and Change Type and pick DateTime.
All done! Just close and apply.
Now all that data is loaded in to Power BI, you can see it on the right hand side.

Expand Data and you can see those column headers.
You will also see that ‘Date’ has a Date Hierachy, it is smart, we can pull in Months and Years. It was definitely worth that extra step!
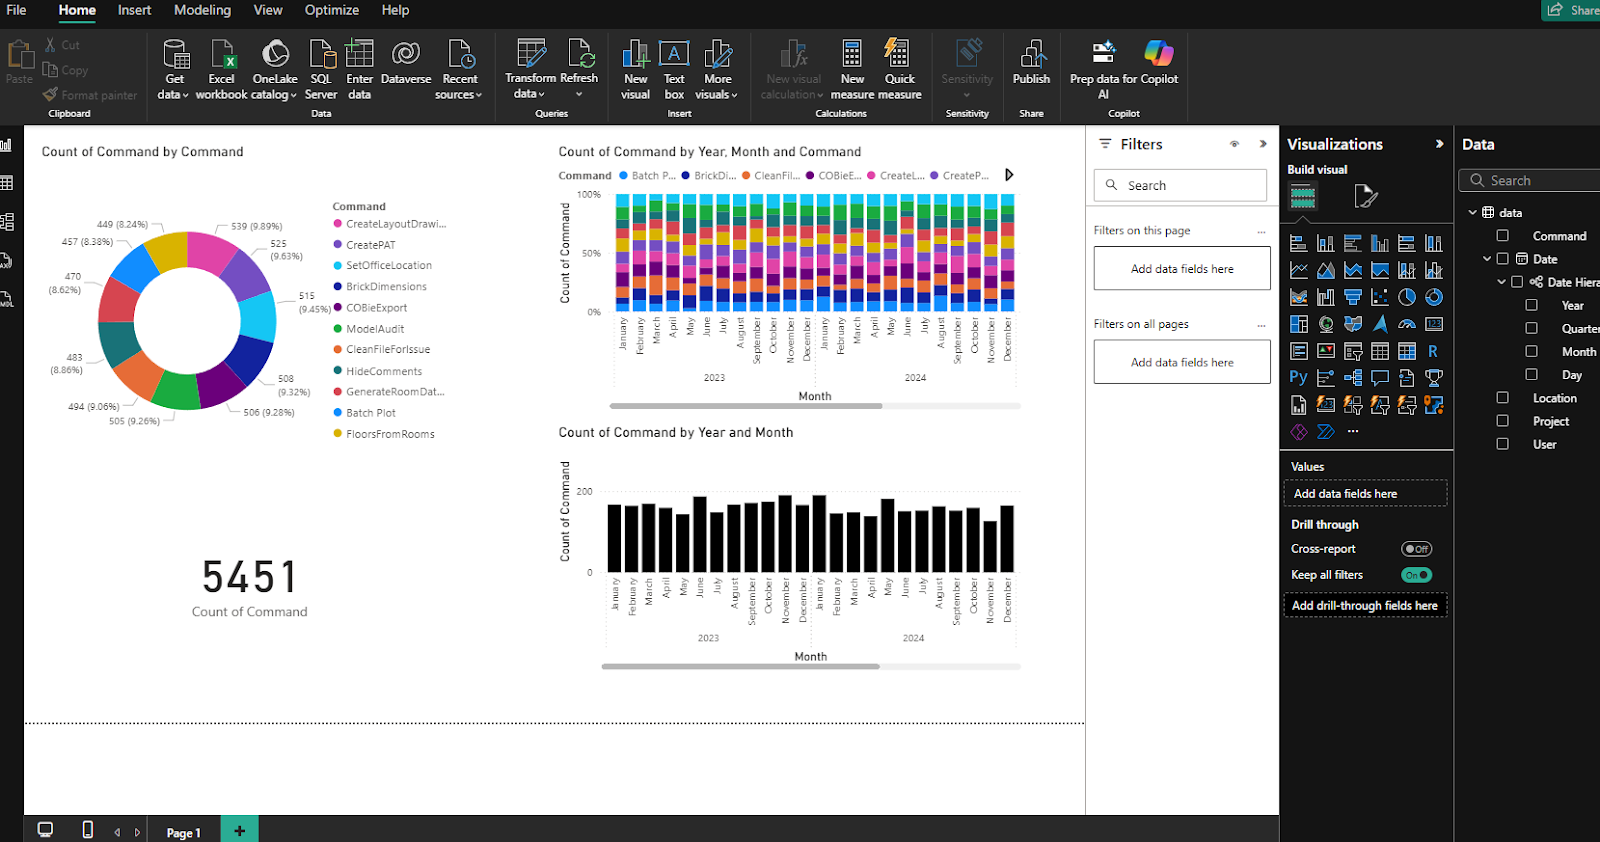
So now we make some graphs. You can see these are presets in the Visualisations part.
All we do is click on one!
- Let’s chose the bar chart in the middle of the top row.
See how it appears on the sheet.
All we do now is drag our fields across into
- X and
- Y fields
And it starts to populate!
Have a play, you can make the bars a different colour, change the Titles, add a Legend, there is a lot of control.
You can also make pie charts, tables and many other things.
You can add filters to remove data you don’t want (file name is Test).
Have fun and make something exciting to show!
Great.
So now, here comes the biggy…
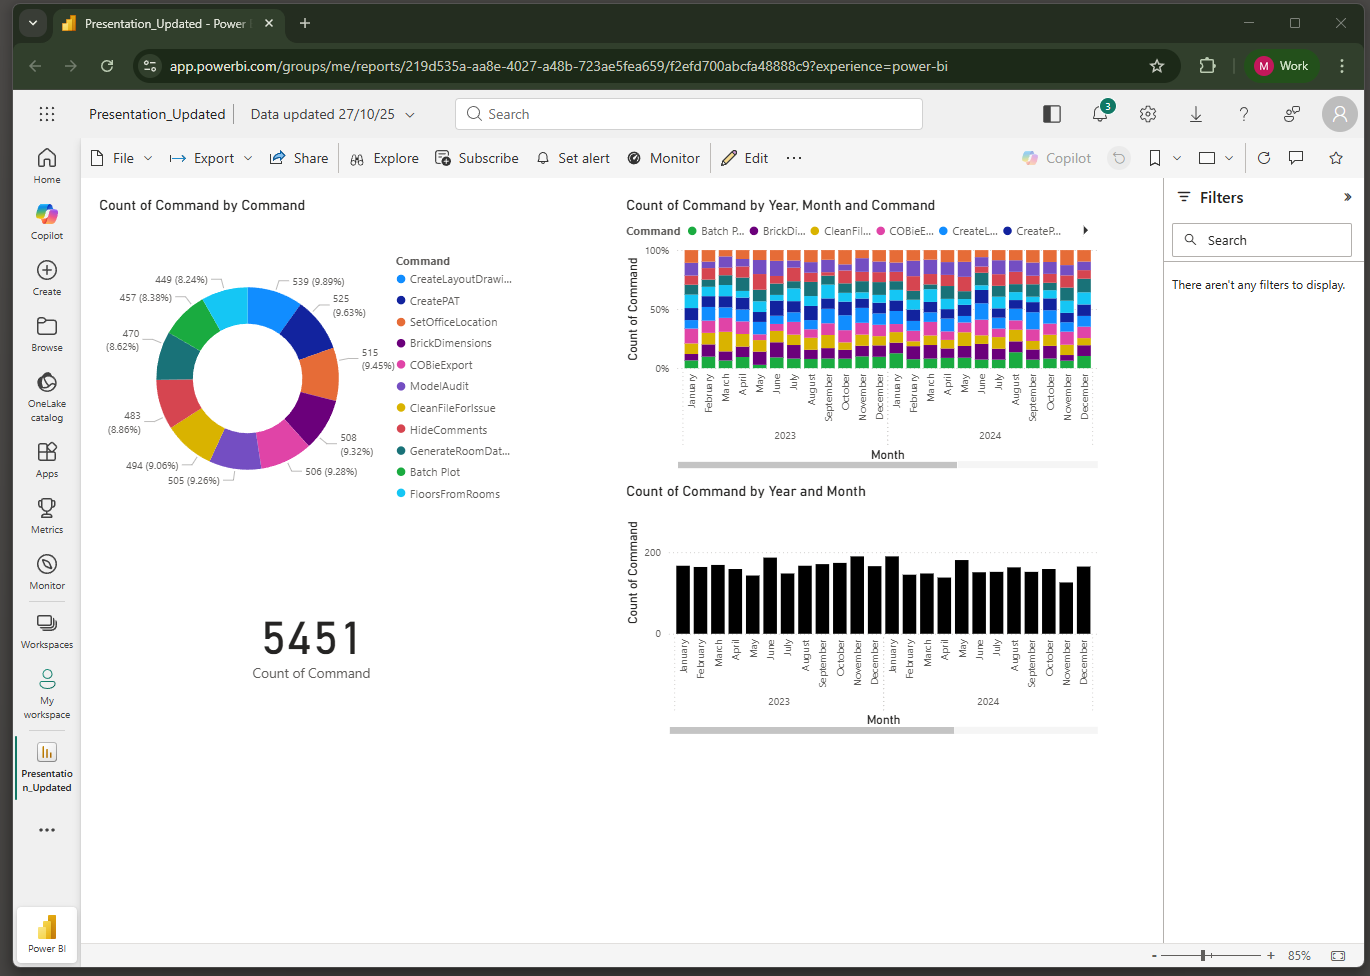
When we have a presentation, we don’t do any exports, we have our dashboard ready.
And next month, when we do our update, we just hit refresh and all our data is current!
This is an investment of time that just keeps paying back!
One final thing for now, we can ‘publish’, drop the Power BI into the cloud and show our boss next time we’re on the train…
Future Enhancements
Future Enhancements
This is just the beginning of your journey!
For PyRevit, it is easy to see that the hook files can be customized with whatever code you wish to pull, so do consider all eventualities, if you start to pull more data than you really need now, you have flexibility to interrogate it later.
Hooks can be used for all sorts of other useful BIM Manager tasks, like stopping people inserting DWG files! And logging sync times (go check out the Aussie BIM Guru again). Which you can do a whole other set of visualisations.
Naturally that feeds into Model Health analysis.
You can really start building up your own toolkit, perhaps you have some Dynamo files to add in there.
Power BI has so much more that you can do, just keep playing around with the functions. There are some very cool things you can do to stream Revit files into PowerBi and have a whole 3D file to show off, go look at Speckle and Tracer (ProvingGround
As has been mentioned, once you are deep into analysis, you might consider shifting to the PyRevit Telemetry, there are also solutions like BIMBeats if you get enough traction with your Partners/Board.
Conclusion
We have looked at the advantages of logging and visualising our Addin Data.
We have seen how easy it is to create our own data logging workflow and visualise it in Power BI.
We have worked through step by step, installing PyRevit, adding our own Code, creating log files, and bringing them into Power BI and creating visualisations.
We have thought about how we can take these ideas further, should we gain more traction.
Congratulations on making it this far and good luck!
Feel free to reach out to us here at Reope, we are experts at these processes and are excited by the possibilities of working with you!


Endorsed by top experts:


Sol Amour
Autodesk
Reope’s found some awesome improvements and was a joy to work with. We look forward to working more with this talented team in the future.

Magne Ganz
Multiconsult
Without Night Runner, we would be stuck with 'impossible' manual maintenance tasks and with models with severe deviations.It helps us automate the process of standardizing several Revit models in large projects, so the downstream processes for cost calculation and other deliveries stay consistent.

Kristján Karl Kristjánsson
Nordic Office of Architecture
Reope has saved us and our clients thousands of hours by automating the standardization of our BIM deliveries. They have helped us deliver high quality data daily with minimal resource use.

Francis Brekke
Oslo Works
The principal element of Suprematism in painting, as in architecture, is its liberation from all social or materialist tendencies. Through Suprematism, art comes into its pure and unpolluted form.

Alfonso Monedero
Heatherwick Studio
Since we started working with Reope, we have been able to convert our automation ideas into real workflows. The mix of skills they have, combining architectural understanding and coding expertise, have meant they understood our struggles and were able to create solutions in such a short time, we could implement them straight away.
Sol Amour
Autodesk
Reope’s found some awesome improvements and was a joy to work with. We look forward to working more with this talented team in the future.
Magne Ganz
Multiconsult
Without Night Runner, we would be stuck with 'impossible' manual maintenance tasks and with models with severe deviations.It helps us automate the process of standardizing several Revit models in large projects, so the downstream processes for cost calculation and other deliveries stay consistent.
Kristján Karl Kristjánsson
Nordic Office of Architecture
Reope has saved us and our clients thousands of hours by automating the standardization of our BIM deliveries. They have helped us deliver high quality data daily with minimal resource use.
Francis Brekke
Oslo Works
The principal element of Suprematism in painting, as in architecture, is its liberation from all social or materialist tendencies. Through Suprematism, art comes into its pure and unpolluted form.
Alfonso Monedero
Heatherwick Studio
Since we started working with Reope, we have been able to convert our automation ideas into real workflows. The mix of skills they have, combining architectural understanding and coding expertise, have meant they understood our struggles and were able to create solutions in such a short time, we could implement them straight away.